Found 56 repositories(showing 30)
Aryia-Behroziuan
An ANN is a model based on a collection of connected units or nodes called "artificial neurons", which loosely model the neurons in a biological brain. Each connection, like the synapses in a biological brain, can transmit information, a "signal", from one artificial neuron to another. An artificial neuron that receives a signal can process it and then signal additional artificial neurons connected to it. In common ANN implementations, the signal at a connection between artificial neurons is a real number, and the output of each artificial neuron is computed by some non-linear function of the sum of its inputs. The connections between artificial neurons are called "edges". Artificial neurons and edges typically have a weight that adjusts as learning proceeds. The weight increases or decreases the strength of the signal at a connection. Artificial neurons may have a threshold such that the signal is only sent if the aggregate signal crosses that threshold. Typically, artificial neurons are aggregated into layers. Different layers may perform different kinds of transformations on their inputs. Signals travel from the first layer (the input layer) to the last layer (the output layer), possibly after traversing the layers multiple times. The original goal of the ANN approach was to solve problems in the same way that a human brain would. However, over time, attention moved to performing specific tasks, leading to deviations from biology. Artificial neural networks have been used on a variety of tasks, including computer vision, speech recognition, machine translation, social network filtering, playing board and video games and medical diagnosis. Deep learning consists of multiple hidden layers in an artificial neural network. This approach tries to model the way the human brain processes light and sound into vision and hearing. Some successful applications of deep learning are computer vision and speech recognition.[68] Decision trees Main article: Decision tree learning Decision tree learning uses a decision tree as a predictive model to go from observations about an item (represented in the branches) to conclusions about the item's target value (represented in the leaves). It is one of the predictive modeling approaches used in statistics, data mining, and machine learning. Tree models where the target variable can take a discrete set of values are called classification trees; in these tree structures, leaves represent class labels and branches represent conjunctions of features that lead to those class labels. Decision trees where the target variable can take continuous values (typically real numbers) are called regression trees. In decision analysis, a decision tree can be used to visually and explicitly represent decisions and decision making. In data mining, a decision tree describes data, but the resulting classification tree can be an input for decision making. Support vector machines Main article: Support vector machines Support vector machines (SVMs), also known as support vector networks, are a set of related supervised learning methods used for classification and regression. Given a set of training examples, each marked as belonging to one of two categories, an SVM training algorithm builds a model that predicts whether a new example falls into one category or the other.[69] An SVM training algorithm is a non-probabilistic, binary, linear classifier, although methods such as Platt scaling exist to use SVM in a probabilistic classification setting. In addition to performing linear classification, SVMs can efficiently perform a non-linear classification using what is called the kernel trick, implicitly mapping their inputs into high-dimensional feature spaces. Illustration of linear regression on a data set. Regression analysis Main article: Regression analysis Regression analysis encompasses a large variety of statistical methods to estimate the relationship between input variables and their associated features. Its most common form is linear regression, where a single line is drawn to best fit the given data according to a mathematical criterion such as ordinary least squares. The latter is often extended by regularization (mathematics) methods to mitigate overfitting and bias, as in ridge regression. When dealing with non-linear problems, go-to models include polynomial regression (for example, used for trendline fitting in Microsoft Excel[70]), logistic regression (often used in statistical classification) or even kernel regression, which introduces non-linearity by taking advantage of the kernel trick to implicitly map input variables to higher-dimensional space. Bayesian networks Main article: Bayesian network A simple Bayesian network. Rain influences whether the sprinkler is activated, and both rain and the sprinkler influence whether the grass is wet. A Bayesian network, belief network, or directed acyclic graphical model is a probabilistic graphical model that represents a set of random variables and their conditional independence with a directed acyclic graph (DAG). For example, a Bayesian network could represent the probabilistic relationships between diseases and symptoms. Given symptoms, the network can be used to compute the probabilities of the presence of various diseases. Efficient algorithms exist that perform inference and learning. Bayesian networks that model sequences of variables, like speech signals or protein sequences, are called dynamic Bayesian networks. Generalizations of Bayesian networks that can represent and solve decision problems under uncertainty are called influence diagrams. Genetic algorithms Main article: Genetic algorithm A genetic algorithm (GA) is a search algorithm and heuristic technique that mimics the process of natural selection, using methods such as mutation and crossover to generate new genotypes in the hope of finding good solutions to a given problem. In machine learning, genetic algorithms were used in the 1980s and 1990s.[71][72] Conversely, machine learning techniques have been used to improve the performance of genetic and evolutionary algorithms.[73] Training models Usually, machine learning models require a lot of data in order for them to perform well. Usually, when training a machine learning model, one needs to collect a large, representative sample of data from a training set. Data from the training set can be as varied as a corpus of text, a collection of images, and data collected from individual users of a service. Overfitting is something to watch out for when training a machine learning model. Federated learning Main article: Federated learning Federated learning is an adapted form of distributed artificial intelligence to training machine learning models that decentralizes the training process, allowing for users' privacy to be maintained by not needing to send their data to a centralized server. This also increases efficiency by decentralizing the training process to many devices. For example, Gboard uses federated machine learning to train search query prediction models on users' mobile phones without having to send individual searches back to Google.[74] Applications There are many applications for machine learning, including: Agriculture Anatomy Adaptive websites Affective computing Banking Bioinformatics Brain–machine interfaces Cheminformatics Citizen science Computer networks Computer vision Credit-card fraud detection Data quality DNA sequence classification Economics Financial market analysis[75] General game playing Handwriting recognition Information retrieval Insurance Internet fraud detection Linguistics Machine learning control Machine perception Machine translation Marketing Medical diagnosis Natural language processing Natural language understanding Online advertising Optimization Recommender systems Robot locomotion Search engines Sentiment analysis Sequence mining Software engineering Speech recognition Structural health monitoring Syntactic pattern recognition Telecommunication Theorem proving Time series forecasting User behavior analytics In 2006, the media-services provider Netflix held the first "Netflix Prize" competition to find a program to better predict user preferences and improve the accuracy of its existing Cinematch movie recommendation algorithm by at least 10%. A joint team made up of researchers from AT&T Labs-Research in collaboration with the teams Big Chaos and Pragmatic Theory built an ensemble model to win the Grand Prize in 2009 for $1 million.[76] Shortly after the prize was awarded, Netflix realized that viewers' ratings were not the best indicators of their viewing patterns ("everything is a recommendation") and they changed their recommendation engine accordingly.[77] In 2010 The Wall Street Journal wrote about the firm Rebellion Research and their use of machine learning to predict the financial crisis.[78] In 2012, co-founder of Sun Microsystems, Vinod Khosla, predicted that 80% of medical doctors' jobs would be lost in the next two decades to automated machine learning medical diagnostic software.[79] In 2014, it was reported that a machine learning algorithm had been applied in the field of art history to study fine art paintings and that it may have revealed previously unrecognized influences among artists.[80] In 2019 Springer Nature published the first research book created using machine learning.[81] Limitations Although machine learning has been transformative in some fields, machine-learning programs often fail to deliver expected results.[82][83][84] Reasons for this are numerous: lack of (suitable) data, lack of access to the data, data bias, privacy problems, badly chosen tasks and algorithms, wrong tools and people, lack of resources, and evaluation problems.[85] In 2018, a self-driving car from Uber failed to detect a pedestrian, who was killed after a collision.[86] Attempts to use machine learning in healthcare with the IBM Watson system failed to deliver even after years of time and billions of dollars invested.[87][88] Bias Main article: Algorithmic bias Machine learning approaches in particular can suffer from different data biases. A machine learning system trained on current customers only may not be able to predict the needs of new customer groups that are not represented in the training data. When trained on man-made data, machine learning is likely to pick up the same constitutional and unconscious biases already present in society.[89] Language models learned from data have been shown to contain human-like biases.[90][91] Machine learning systems used for criminal risk assessment have been found to be biased against black people.[92][93] In 2015, Google photos would often tag black people as gorillas,[94] and in 2018 this still was not well resolved, but Google reportedly was still using the workaround to remove all gorillas from the training data, and thus was not able to recognize real gorillas at all.[95] Similar issues with recognizing non-white people have been found in many other systems.[96] In 2016, Microsoft tested a chatbot that learned from Twitter, and it quickly picked up racist and sexist language.[97] Because of such challenges, the effective use of machine learning may take longer to be adopted in other domains.[98] Concern for fairness in machine learning, that is, reducing bias in machine learning and propelling its use for human good is increasingly expressed by artificial intelligence scientists, including Fei-Fei Li, who reminds engineers that "There’s nothing artificial about AI...It’s inspired by people, it’s created by people, and—most importantly—it impacts people. It is a powerful tool we are only just beginning to understand, and that is a profound responsibility.”[99] Model assessments Classification of machine learning models can be validated by accuracy estimation techniques like the holdout method, which splits the data in a training and test set (conventionally 2/3 training set and 1/3 test set designation) and evaluates the performance of the training model on the test set. In comparison, the K-fold-cross-validation method randomly partitions the data into K subsets and then K experiments are performed each respectively considering 1 subset for evaluation and the remaining K-1 subsets for training the model. In addition to the holdout and cross-validation methods, bootstrap, which samples n instances with replacement from the dataset, can be used to assess model accuracy.[100] In addition to overall accuracy, investigators frequently report sensitivity and specificity meaning True Positive Rate (TPR) and True Negative Rate (TNR) respectively. Similarly, investigators sometimes report the false positive rate (FPR) as well as the false negative rate (FNR). However, these rates are ratios that fail to reveal their numerators and denominators. The total operating characteristic (TOC) is an effective method to express a model's diagnostic ability. TOC shows the numerators and denominators of the previously mentioned rates, thus TOC provides more information than the commonly used receiver operating characteristic (ROC) and ROC's associated area under the curve (AUC).[101] Ethics Machine learning poses a host of ethical questions. Systems which are trained on datasets collected with biases may exhibit these biases upon use (algorithmic bias), thus digitizing cultural prejudices.[102] For example, using job hiring data from a firm with racist hiring policies may lead to a machine learning system duplicating the bias by scoring job applicants against similarity to previous successful applicants.[103][104] Responsible collection of data and documentation of algorithmic rules used by a system thus is a critical part of machine learning. Because human languages contain biases, machines trained on language corpora will necessarily also learn these biases.[105][106] Other forms of ethical challenges, not related to personal biases, are more seen in health care. There are concerns among health care professionals that these systems might not be designed in the public's interest but as income-generating machines. This is especially true in the United States where there is a long-standing ethical dilemma of improving health care, but also increasing profits. For example, the algorithms could be designed to provide patients with unnecessary tests or medication in which the algorithm's proprietary owners hold stakes. There is huge potential for machine learning in health care to provide professionals a great tool to diagnose, medicate, and even plan recovery paths for patients, but this will not happen until the personal biases mentioned previously, and these "greed" biases are addressed.[107] Hardware Since the 2010s, advances in both machine learning algorithms and computer hardware have led to more efficient methods for training deep neural networks (a particular narrow subdomain of machine learning) that contain many layers of non-linear hidden units.[108] By 2019, graphic processing units (GPUs), often with AI-specific enhancements, had displaced CPUs as the dominant method of training large-scale commercial cloud AI.[109] OpenAI estimated the hardware compute used in the largest deep learning projects from AlexNet (2012) to AlphaZero (2017), and found a 300,000-fold increase in the amount of compute required, with a doubling-time trendline of 3.4 months.[110][111] Software Software suites containing a variety of machine learning algorithms include the following: Free and open-source so
ahrimhan
Data science projects: 1) Prediction of Score for Public Scores in California and 2) Sentiment Analysis of Movie Reviews using a Deep Learning Convolutional Neural Network
HunterKane
Project 1: Explanatory Data Analysis & Data Presentation (Movies Dataset) Project Brief for Self-Coders Here you´ll have the opportunity to code major parts of Project 1 on your own. If you need any help or inspiration, have a look at the Videos or the Jupyter Notebook with the full code. Keep in mind that it´s all about getting the right results/conclusions. It´s not about finding the identical code. Things can be coded in many different ways. Even if you come to the same conclusions, it´s very unlikely that we have the very same code. Data Import and first Inspection Import the movies dataset from the CSV file "movies_complete.csv". Inspect the data.
datascisteven
Movie Analysis Project (Phase 1 Project for Flatiron School Data Science Bootcamp)
khyateed
Exploratory data analysis of movie data, using web-scraping, statistical testing, and data visualization (Flatiron Project 1)
FakenewsNet is a repository for an ongoing data collection project for fake news research at ASU. The repository consists of comprehensive dataset of Buzzfeed news and politifact which contains two separate datasets of real and fake news. The FakenewsNet consists of multi-dimension information that not only provides signals for detecting fake news but can also be used for researches such as understanding fake news propagation and fake news intervention. However, the repository is very wide and multi-dimensional, In this project, we perform a detailed analysis on Buzzfeed news dataset. The Buzzfeed news dataset comprises a complete sample of news published in Facebook from 9 news agencies over a week close to the 2016 U.S. election from September 19 to 23 and September 26 and 27. Every post and the linked article were fact-checked claim-by-claim by 5 BuzzFeed journalists. There are two datsets of Buzzfeed news one dataset of fake news and another dataset of real news in the form of csv files, each have 91 observations and 12 features/variables. The Buzzfeed news dataset consists of two datasets which has the following main features: id: the id assigned to the news article webpage Real if the article is real or fake if reported fake. title : It refers to the headline that aims to catch the attention of readers and relates well to the major of the news topic. text : Text refers to the body of the article, it elaborates the details of news story. Usually there is a major claim which shaped the angle of the publisher and is specifically highlighted and elaborated upon. source: It indicates the author or publisher of the news article. images: It is an important part of body content of news article, which provides visual cues to frame the story. movies: It is also an important part of news article, a link to video or a movie clip included in a article, also provides visual cues to frame the story. In this analysis, we do not consider features like url, top_img, authors, publish_date, canonical link and metedata because these usually provide redundant information which we can be obtained from other main variables and do not add more value to our analysis. The two main features we care about are the source of the fake news and the language used in the fake news. In particular, we are interested in finding sources which published fake news and finding words that are more associated with one category than other. The main purpose of this analysis is to develop methods to analyze fake news versus real news. This project is divided into two parts: (1) Exploratory Data Analysis (2) Classification. The goal of the second part is to build a classifer that can predict and detect fake news. We use three different classifiers to classify documents into real/fake news categories.
FrankOyugi
No description available
Ahmed-Abdelrahman03
Just wrapped up a data analysis project on the IMDb Top 1000 movies.
No description available
This data analysis project aimed to investigate the properties associated with high revenue movies and the most popular movie genres from year to year. To achieve this, a dataset of approximately 10,000 movies from The Movie Database (TMDb) was downloaded from Udacity's Project 1 course.
vaibhav-umbarkar47
This project presents an in-depth analysis of IMDb movie data using Power BI. The goal is to identify key trends in movie performance, including revenue, ratings, genres, and runtime impact. All insights are based on a cleaned dataset of 1,000 movies.
SofyanMH
This project investigates various aspects of "The Movie Database" (TMDB). The project starts with a breif descibtion of the rationale behind the data wrangling done and the Python code for cleaning and trimming the dataset for the analysis of the project. Then, the analysis of the projected are presented in two sections: 1) Comparison between my favorite directors in terms of movie rating, runtime and profit; 2) How have the popularity, revenues and budgets of superhero movies change over the last 20 years?
rupam1305
In this case study we perform Reading , Inspection ,Data Cleaning of IMDb Movies and Data Analytics Using Numpy and Pandas, IMDb registered users can cast a vote (from 1 to 10) on every released title in the database. Individual votes are then aggregated and summarized as a single IMDb rating, visible on the title's main page.so this rating describes the popularity of a movie in the public. The dataset has been downloaded from IMDb Dataset. The dataset contains only one csv file i.e IMDB_Movies.csv has been used in this project for the analysis. The libraries for data analysis and visualization used in this project are Numpy and Pandas.
Krithikha20
# Sentiment-analysis - Sentimental analysis on Movie review is explained where the reviews are classified into Positive , Negative and Neutral. - The task is to learn to predict movie ratings based on the review. 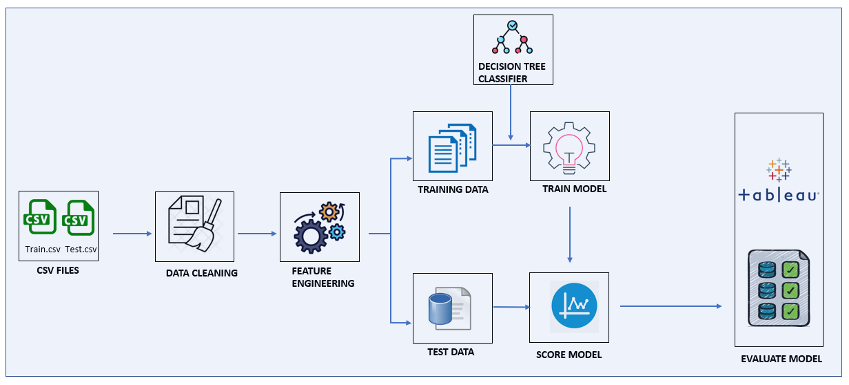 # DATA COLLECTION - Data used for this project is from Kaggle (https://www.kaggle.com/c/sentiment-analysis-on-movie-reviews/data) - Data has training and test zip folders. - It is a large data set with 156060 reviews in training set and 66292 reviews in test set. - Dataset has two fields: - id - an id unique to a given file - Sentiment labels range between 0 – 4. The sentiment labels are: - 0 - negative - 1 - somewhat negative - 2 - neutral - 3 - somewhat positive - 4 - positive # PROCESSING - Data cleaning is performed such as removing null values and blank lines. - Processing function is defined where stemming, lemmatizing and stopwords are removed to reduce the dimensionality of the data and improve the model performance. - Stemming – suffix of words are removed. - Lemmatizing – similar to stemming but retains the dictionary form of the word - Stopwords – removing the common words such as 'is', 'the' etc. - Also, the target variable ‘Sentiment’ was converted to three unique values from 5, where , - 0 - negative - 1 - neutral - 2 - positive # VISUALIZATION 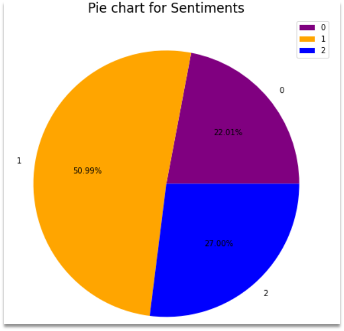 - The pie chart shows the distribution of the sentiments 0, 1 and 2 . - We can infer that - Negative sentiment(0) has 22% of the whole reviews. - Neutral (1)contributes to half the reviews of about 50.99%. - Positive (2) has 27% reviews. # Result - Classification Report - An overall of 90% on Training data and 70% on test set is achieved. - The precision , recall and f1 score ranges between 65% to 75 % indicating a model to be pretty good 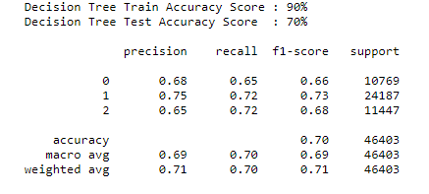 # TABLEAU - Tableau is used for visualization to get insights about the data. - It has an advantage of handling large data and is super interactive. 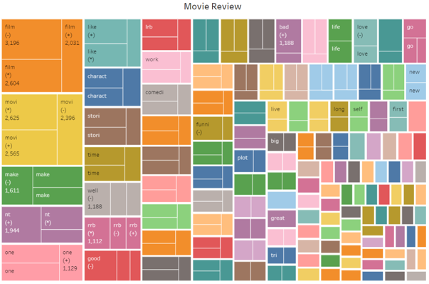 # Refrences 1) https://www.kaggle.com/c/sentiment-analysis-on-movie-reviews/data 2) https://prod-ca-a.online.tableau.com/#/site/georgianc/views/Assign_AI_Infra/Sheet63?:iid=2 3) https://scikit-learn.org/stable/modules/generated/sklearn.tree.DecisionTreeClassifier.html 4) https://www.nltk.org/
suy1968
Movie_Recommendation-Engine Introduction: Recommender System are widely used today in all most all the applications.The purpose of a recommender system is to suggest users something based on their interest or usage history.Two most ubiquitous types of personalized recommendation systems are Content-Based and Collaborative Filtering. Collaborative filtering produces recommendations based on the knowledge of users� attitude to items, that is it uses the �wisdom of the crowd� to recommend items. In contrast, content-based recommendation systems focus on the attributes of the items and give you recommendations based on the similarity between them. We have created a Recommender sysem using Spotify We have Scrapped dataset from SPOTIFY using our custom scraper, "Scrapify". The Scrapped data is converted to as csv file and used for further processing.The dataset contains appromixately 11k observations Data Description: -name : Name of the user -artist : Name of the artist -danceability : Ranges from 0 to 1 -key : Ranges from 0 to 11 -mode : Ranges from 0 and 1 -instrumentalness : Ranges from 0 to 1 -duration : Duration of the song in minutes -energy : Ranges from 0 to 1 -loudness : Float typically ranging from -60 to 0 -speechiness : Ranges from 0 to 1 -acousticness : Ranges from 0 to 1 -tempo : Float typically ranging from 0 to 150 -liveness : Ranges from 0 to 1 -valence : Ranges from 0 to 1 -popularity : Ranges from 0 to 100 -hollywood : Hollywood song 1 | Bollywood song 0 Project Goals The goals for this project are: -Scrap the website and collect the required data -Organise the data into a Structured format Gather insights from data analysis about the columns used Perform EDA and remove unwanted columns -Use the Cosine Similarity to calculate a numeric quantity that denotes the similarity between two songs. Since we have used the vectors, calculating the Dot Product will directly give us the Cosine Similarity Score. Ouput the top 5 recommended songs Technologies Used: Python Google Colab Spotify API & custom scraper
ApoorvRusia
Star Wars is an American epic space opera media franchise, centered on a film series created by George Lucas. It depicts the adventures of characters "a long time ago in a galaxy far, far away". The franchise has already released 10 movies and a few in the production line. The project was created towards the course: IN SC 846 Network and Predictive Analytics for Socio-Technical Systems. We have taken first 7 episodes of the Star Wars series for analysis. The goals of the project were:- 1. To identify the key actors in the movie. 2. Their progression over the series 3. How they have had impacted the storyline. 4. Their reach and information distribution capacity. Tools and packages used - RStudio with igraph package data source: http://www.imsdb.com/
Introduction Keeping with the spirit of the project, differences between this phase and previous will be relatively minimal besides the methods of parallelisation. Your code will read in the same movie metadata CSV files and sort the data in them with mergesort. Your code will also need to scan through the directory it is called on and sort each file in that directory and all files in all subdirectories. The major differences are that your program will instead spawn a new thread to search each directory and sort each file rather than a new process. Since all your computation will be in the same address space, you need not make separate files. The sorted output of all files will go to a single output file. Be sure that in the case of any bad input or a bad status code that your program fails gracefully, closes files, frees memory and exits threads. Under no condition should your code crash on a segmentation fault. As your code runs your threads should output similar metadata to STDOUT as the previous phase. Each thread should output the number of threads it created along with their threadIDs. Finally, you should study the differences between threads and processes for multicomputing. The metrics you should compute are detailed below. Methodology a. Command line flags Your code will read in a set of flags via the command line. They are '-c', '-d' and '-o'. Note: 'optional' and 'mandatory' below refer to your code's operation only. You must implement all three flags. Mandatory flags must be present for your code to run. Optional flags may or may not be present. If they are not, your code should take the specified default behavior. You must support all flags. '-c' indicates sorting by a column. The files read in by your code should be sorted by the column name that immediately follows '-c'. This flag is required. If it is not present, your code should print an error message, usage information and return. '-d' indicates a starting directory. The program will start at this directory name immediately following '-d' to look for CSV files to sort. This flag is optional. If this flag is not present, the default behavior of your code should be to start searching at the current directory. '-o' indicates the output directory for the sorted file. The program will store the sorted file to the directory name immediately following the '-o'. This flag is optional. If this flag is not present, the default behavior of your code should be to store the sorted file in the current directory. These flags may be defined in any order. For instance: $ ./sorter -c movie_title -d thisdir -o thatdir $ ./sorter -d thisdir -o thatdir -c movie_title $ ./sorter -d thisdir -c movie_title -o thatdir .. are all valid and would operate identically. b. File Structure CSV file structure remains unchanged. Records will be stored in CSV files in the provided directory. As mentioned above, directory structures may have multiple levels and you must find all CSV files. Your code should ignore non-CSV files and CSV files that do not have the correct format of the movie_metadata CSV (e.g. CSV files that have other random data in them). c. File Sorting Your code will be reading in and traversing entire starting directory and each contained subdirectory. Your code should open and sort each CSV file found that contains move data. Your code's output will be single CSV file outputted to a file named: AllFiles-sorted-<fieldname>.csv. Your code should create a new thread to handle each subdirectory found, and each file found. Each file thread should read in and sort that file using Mergesort. You are welcome to implement another sorting algorithm, but it must be written entirely your self. Once sorted, Instead of writing out the sorted version, your file threads should write their data in to some common data structure in the heap. Once all CSV files have been sorted your code must take the individually-sorted files and integrate all the results to create a single sorted file containing all the records read in. It would be advisable to insert the per-file data in to a globally-accessible sorted data structure. Be sure to keep this data structure propertly synchronized, however. You will need to make use of synchronization mechanisms to be sure that your updates are handled in a consistent and coherent manner. d. Metadata Your threads should write metadata to STDOUT while running. It should be in the following format and order: Initial PID: XXXXX TIDS of all child threads: AAA,BBB,CCC,DDD,EEE,FFF (... etc.) Total number of threads: ZZZZZ e. Analysis Lastly, you will use the time utility to time the execution of your program: $ time ./sorter -c movie_title -d thisdir -o thatdir real: 0mXXXs user: 0mYYYs sys: 0mZZZs You should run your Project 1 sorter on the same files/directory and record the differences. You should build a variety of different directory structures and file sizes and test your current sorter and Project 1 sorter on both. The goal is to see how multiprocessing compares in speed to multithreading. See how the two compare with: - long subdirectory chains - lots of files in a single directory - combinations of the two In particular, see how the time differs as the number of files and/or directories increase. For instance, collect timing information for both programs with a single directory and 1, 2, 4, 8, 16, 32, 64, 128, 256, 512 and 1024 files. Plot the time taken vs number of files to see if there is a definite trend for both programs. It would be a good idea to run each test multiple times and average the results. Other users, the speed of the hard drives, the OS scheduler, the difficulty in sorting the files, and any number of other factors may alter your results. It would be a very good idea to automate as much as you can. You may want to write some simple code to automatically create N files to be sorted, to run your code and collect the time results. It may sound like unnecessary extra work, but running everything manually by hand will likely take much more time than automating it. Let the machine do the boring work. Welcome to Computational Science! Results Submit your "sorter_thread.c", "sorter_thread.h" and "mergesort.c" as well as any other source files your header file references. Document your design, assumptions, difficulties you had and testing procedure. Include any test CSV files you used in your documentation. Be sure to also include a short description of how to use your code. Look at the man pages for suggestions on format and content. Do not neglect your header file. Be sure to describe the contents of it and why you needed them. Include a file called analysis.pdf that describes your findings from executing the time utility. Discuss why the results are the way they are. Be sure to answer the following questions: Is the comparison between run times a fair one? Why or why not? What are some reasons for the discrepancies of the times or for lack of discrepancies? If there are differences, is it possible to make the slower one faster? How? If there were no differences, is it possible to make one faster than the other? How? Is mergesort the right option for a multithreaded sorting program? Why or why not? Extra Credit a. (30 points) Implement the fastest (wall clock time) program. Your program will be compared against all other submitted programs in the class. The programs that are among the top 10% fastest implementations will receive the 30 points. The time that will be used is the real time reported by time. To achieve this, you may need to re-examine your data structures and algorithms to optimize your code for speed. b. (20 points) Implement a fast (wall clock time) program. If your program is not within the top 10% but is within the top 30% of timed finishers. You will receive 10 points. *In the event that all groups submit programs that run with times that are not different in statistically significant ways, we will give everyone 5 points extra credit.
raizelistaken
No description available
raaviharshini19
Project 1: Quality Movie Data Analysis
We will be using this data to act as a means to demonstrate our skill in using Python to play with data
RS291
Module 1 Final Project - Movie data analysis
HarshSiroya
Data Mining Movie Summary Analysis (Project-1)
ismailfarhang01
Hollywood Movies data analysis
MeghanaShabad15
No description available
jfleury12
Module 1 project on movie exploratory data analysis
No description available
hrithikgupta20
No description available
sophiejuco
DSGA-1001 Data Analysis Project 1: Analysis of movie ratings data set
The project analyzes a dataset containing movie information, performs data manipulation and visualization, and integrates API usage to retrieve additional movie details from Wikipedia.
avigyan1112
No description available